 Lagos, NG • GMT +1


 3928 views
Sunday, December 11, 2016/Proshare Research
The Diagnosis
Analysis of the market activity in the week ended December 09, 2016 technically revealed a sustained but low optimistic trading pattern while investors maintained low bargain hunting postures towards few weathered blue chips.
Also, an extensive analysis revealed low accumulation pattern while investors displayed high speculative tendency, particularly in Financial Services, Oil & Gas and Conglomerates sectors.
In addition, volume analysis revealed active bargain tendency towards TRANSCORP, FIDELITYBK, FO and FBNH while investors sustained sell postures towards DIAMONDBNK, OANDO, UNILEVER and UAC-PROP.
Furthermore, investors displayed fresh and sustained bargain tendency in some active sector(s), particularly in Oil & Gas, Agriculture and Financial Services sector(s). However, we observed fresh and growing sell tendency in Industrial Goods, Healthcare, Consumer Goods and Construction/Real Estate sector(s).
Summarily, the bulls dominated the week, strengthening the key benchmark index by 76.86 points against 407.44 gain recorded in the previous week to close at 25,817.69- ASI remains battered below its key resistance level at 41,957.50.
In addition, the All Share Index traded within the range of 25,817.69 (week-high) and 25,671.23 (week-low) to settle at 25,817.69 - above previous week’s high (25,740.83) by 76.86- This indicates sustained bargain sentiments when compared with previous posture. The outlook reveals weak bargain postures.
In the week just ended, market breadth closed negative at 0.81x against 1.04x recorded in the previous week on the back of waning bargain sentiments.
Likely trends in the coming periods: We expect mixed sentiments to dictate trading pattern in the coming week- an indication to high price volatiltiy ahead..jpg)
Technically, market sentiments during the bearish week favoured liquid and active stocks of Medium Cap categories in the sector(s) but with stronger positive sentiments in Oil & Gas, Agriculture, Conglomerates, Financial Services and Services sector(s), which further revealed the sector(s) investors patronised in the week.
On the other hand, it was observed that negative sentiments appeared stronger in,Industrial Goods, Consumer Goods, Healthcare and Construction/Real Estate
.jpg)
Stock Trend & Direction
We conducted a review of stocks that have sharpened market direction and performance in the week - using technical tools like RSI, MACD, VOLUME, MFI, CANDLESTICK, MOVING AVERAGES, BOLLIGER BANDS and ACCUMULATION & DISTRIBUTION to reveal investors’ sentiments towards the market movers.
THE BIG VOLUME
DIAMONDBNK experienced moderate sell tendency to close with negative sentiments in the week. The stock recorded -7.60% loss in the week against -3.20% loss recorded in the previous week.
The outlook in the week revealed sustained sell-down pattern, extending a prolonged 24weeks sell-down trading pattern to record -64.14% loss experienced between June 24th and December 9th 2016
In addition, technical indicator (MACD) revealed growing sell sentiments towards the stock while RSI and CCI revealed falling price momentum. The stock closed bearish in both short-term and mid-long term periods, indicating growing presence of bears towards the stock as revealed by its price moving averages.
Also, we observed moderate growth in bearish volume during the week, indicating active distribution from investors during the week.
Technical conclusion on sentiments: The stock has low chance, with low reliability to reverse downtrend pattern in the coming session, considering the fresh coming of new buyers. A Buy Signal! Chart below shows MACD, candlestick, RSI and volume analysis
.jpg)
THE GAINERS
FO experienced active bargain tendency to close with positive sentiments in the week. The stock recorded +62.80% gain in the week against +3.90% gain recorded in the previous week.
The outlook in the week revealed a sustained price recovery pattern in the last 2weeks to record +69.16% gain, experienced between November 25th and December 9th 2016.
In addition, technical indicator (MACD) revealed active bargain tendency towards the stock as RSI and CCI revealed sharp uptrend momentum. The stock closed neutral in short-term but remained bearish in mid-long term periods, indicating growing presence of bulls towards the stock as revealed by its price moving averages.
Technical conclusion on sentiments: The stock has moderate chance, with moderate reliability to extend uptrend in the coming session, considering the active demand postures and upper breakout observed during last session. A Buy Signal! Chart below shows MACD, candlestick, RSI and volume analysis
THE LOSERS
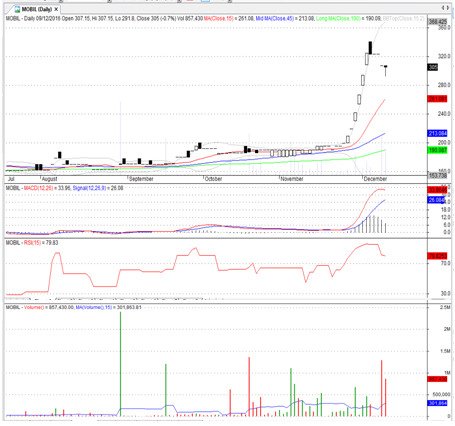
MOBIL experienced moderate sell tendency to close with negative sentiments in the week. The stock recorded -5.90% loss in the week against +55.10% gain recorded in the previous week.
The outlook in the week revealed a fresh profit-taking tendency towards the stock, following an active 14 weeks rally of +165.68%, experienced between August 26th and December 2nd 2016.
Technical indicator (MACD) revealed active sell-down trend with a huge fall in price momentum while the stock closed bullish in both short-term and mid-long term periods. This indicates sustained presence of the bulls towards the stock.
Technical conclusion on sentiments: The stock has low chance, with low reliability, to reverse the sell sentiments in coming sessions, considering the active fight-back from the bulls camp experienced during the week. However, the extreme oversold posture of the stock may still dictate the sentiments southwards. A Cautious Signal! Chart below shows MACD, candlestick, RSI and volume Analysis
Click to view Due Diligence and Price Performance trend.
Click to view more on;
Disclaimer: The information provided herein is our opinion only. Under no circumstances do any statements here represent a recommendation to buy or sell your stocks or make any kind of an investment. You are responsible for your own due diligence. To summarize, we do not provide recommendations nor do we make any claims or promises that any information here will lead to a profit, loss or any other result. They are for your guidance purpose only.


 Sponsored Ad
 Advertise with Us


 Back to top