 Lagos, NG • GMT +1


 1720 views
Tuesday, May 24, 2022 / 6.00 AM / by Teslim Shitta-Bey, CE/ME Proshare with Jariyat Bakare, Proshare Research / Header Image Credit: EcoGraphics
Few, if any, Nigerian bank is priced at a value equal to the liquidation value of their underlying assets. Banks are priced based on investors' wild whims and wobbly expectations. But why? Like the sands of the Sahara, Nigeria's equity market moves in mysterious ways.
Stockbrokers asked about local banks' relatively low price-to-net asset value (NAV) listed on the Nigerian Exchange Limited (NGX) come with explanations that confirmed confusion rather than established conviction. One of the brokers questioned concerning bank net asset valuation noted that "nobody can tell why prices are low relative to net assets. A general notion is that bank loan asset qualities are black boxes, and trying to value bank loan assets is like figuring out how water gets into coconuts. The market simply discounts loan assets, and the higher the loan assets as a proportion of total assets, the lower the likely price to book value ".
A broker with a different brokerage house and an alternative theory responded that "analysts have generally been more concerned about future discounted earnings per share than corporate asset values. So, stock prices reflect expected cash flows rather than present or future asset values."
The difficulty in understanding the low prices of listed banks on Nigeria's NGX brings to mind the often-repeated quote by Phillip Fisher "The stock market is filled with individuals who know the price of everything, but the value of nothing." Fisher's view might be harsh in describing the Nigerian investor, but it may not be far from the mark.
How Price and Value Split Ways
To understand why analysts have been worried about the values of listed stocks on the NGX, a helicopter overview of the market's banking sector leaves analysts' imagination tickled.
Unpacking GTCO's P/BV History
One Nigerian bank that has consistently given investors a high return on equity (RoE) is GTCO, a bank holding company. The bank has maintained one of the sector's lowest cost-to-income ratios (CIRs). Nevertheless, its price to book value (P/BV) over the previous ten years has fallen from 2.4 in 2012 to 1.29 in 2015 (at the beginning of a recession) to 1.94 in 2017 (at the end of a recession). In 2021 the bank's price to book value surprisingly tumbled to 0.95 (see chart 1 below).
Chart 1 GTCO's Net Asset/Price Movements 2012-2021
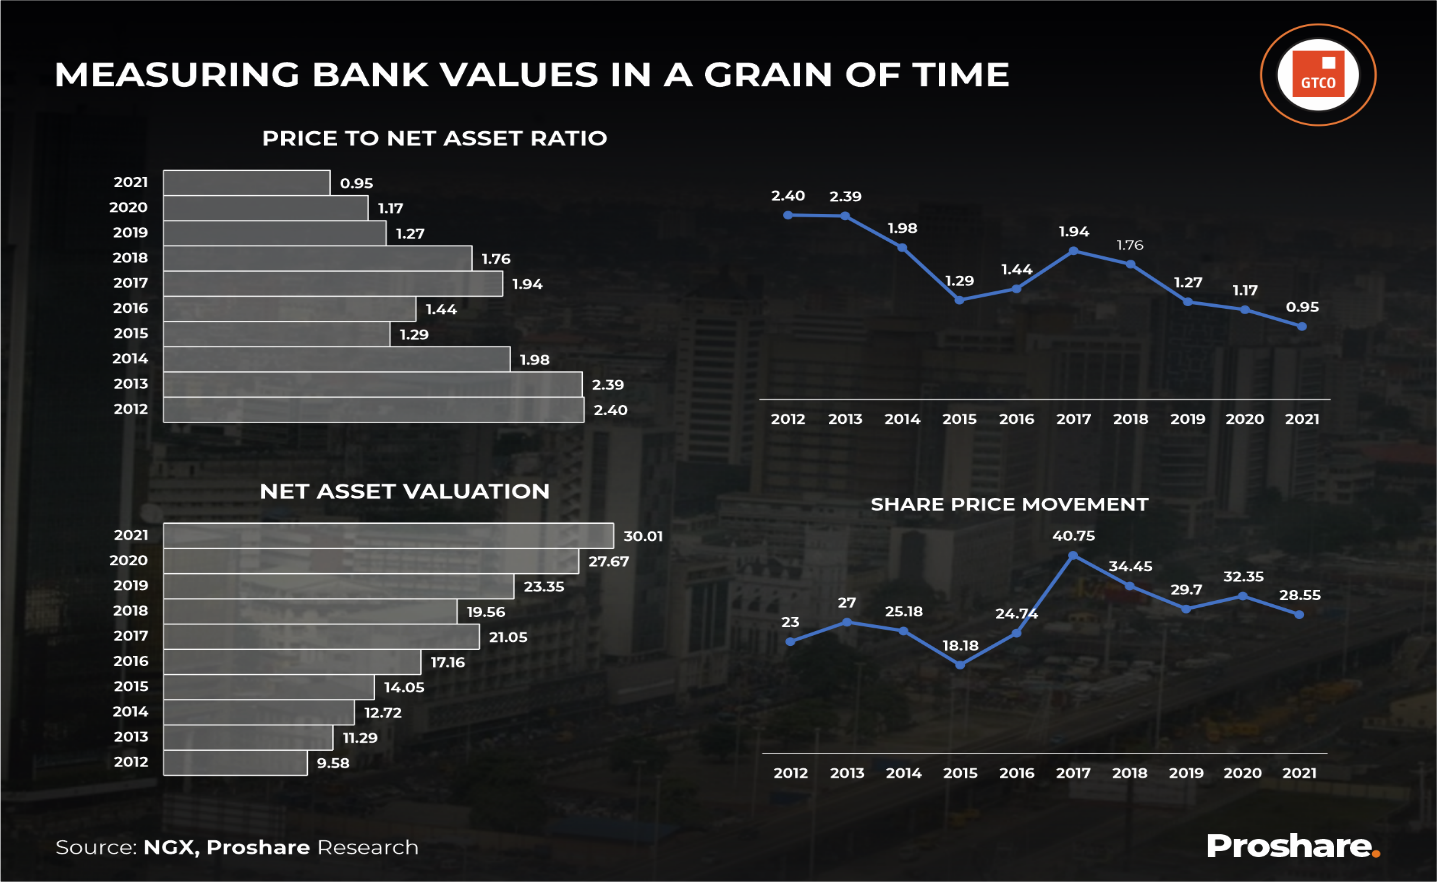
Analysts have observed that GTCO's share price has generally moved in the same direction as its P/BV for most of the last decade, with a few exceptions (like 2013). GTCO's highest recent share price was in 2017 at the end of the 2015/2016 recession. GTCO ended 2017 at N40.75 or 29.93% higher than the N28.55 with which it ended 2021. The fall in GTCO's price between 2017 and 2021 mirrored the drop in the lender's P/BV from 1.94 in 2017 to 0.98 in 2021, or what came to a tumble of 49.49%. The fall in GTCO's P/BV has been steeper than its share price, suggesting that net asset per share has fallen much slower than the market valuation of the money lender's assets.
The average annual compound rise in GTCO's net assets between 2012 and 2021 was +13.52%. While the banking group's average yearly compound decline in P/BV was -9.47%. As net assets grew, the price-to-book value fell because the price could not keep up with net asset growth.
GTCO's P/BV history is not unique; a few other banks have passed through the same journey.
UBA's Jolly P/BV Journey
Analysts expect that a bank's P/BV should be close to one if a bank is appropriately valued (GTCO consistently passed this threshold in the last decade). Corporate finance experts argue that at the point of liquidation, a company's market price should at least be equivalent to its net asset value, meaning that its P/BV should be somewhere around one.
Unfortunately, at least in Nigeria, theory and practice have chosen different paths. Several banks listed on Nigeria's NGX trade at market values of at least a third of their net assets, with a few exceptions. A bank like UBA has only traded at a year-end market value above one only once in the last ten years (in 2013) (see chart 2 below).
Chart 2 UBA's Sliding P/BV and Investors' Unforgiving Pricing
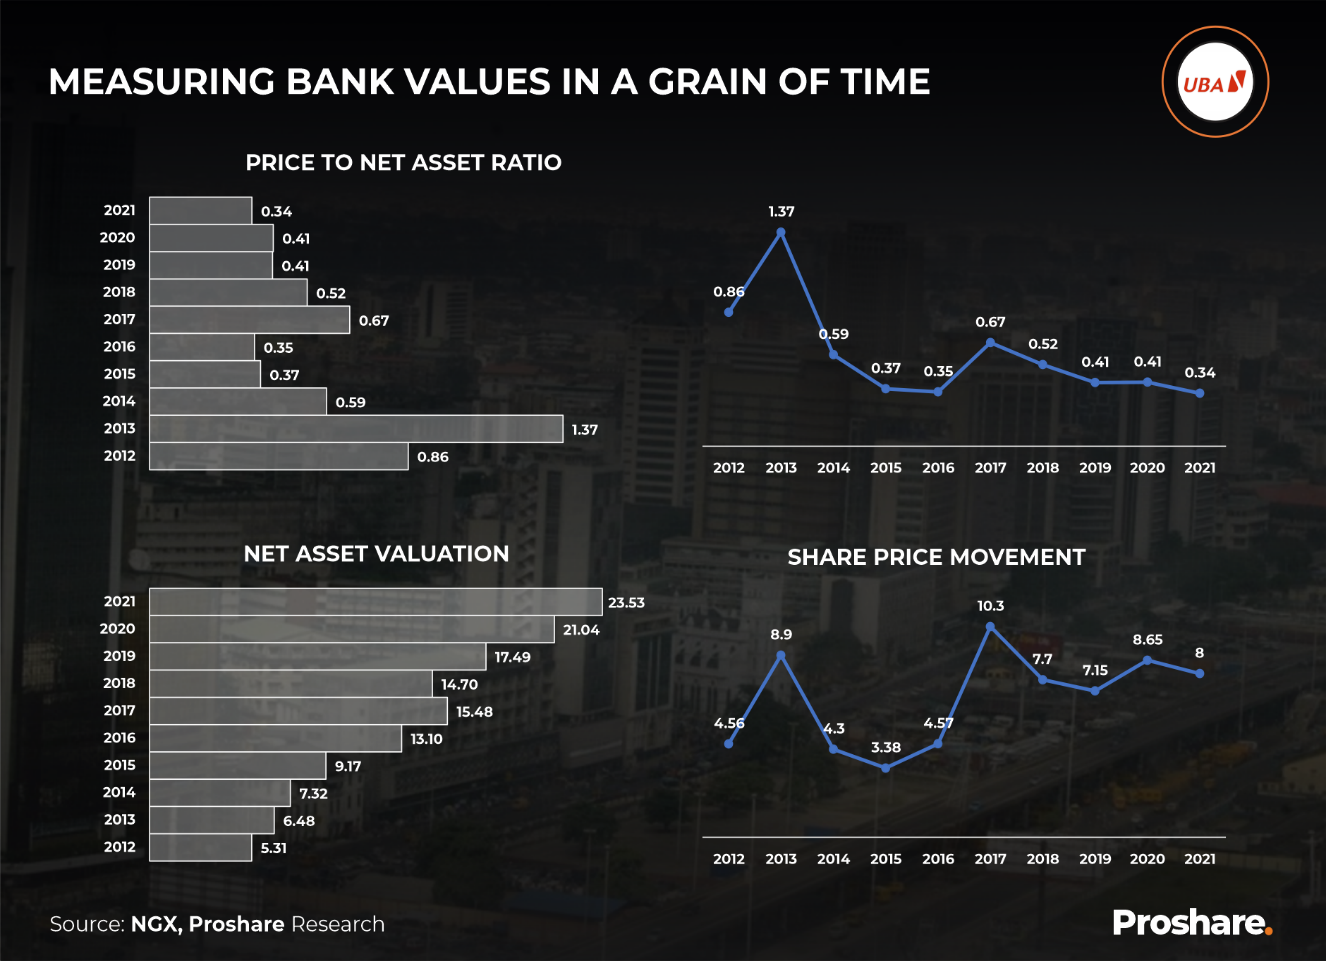
UBA's P/BV fell by -9.80% as net assets rose by +17.99% on an annual compound average basis. The bank's share price dipped from N8.90 in 2013 to its lowest ten-year price of N3.38 in 2015 (end of President Goodluck Jonathan's administration and the beginning of a recession that ended in 2017). UBA's share price rocketed to N10.30 at the end of the recession in 2017, and P/BV soared to 0.67 from 0.35 in 2016. In 2021 the bank's P/BV settled at 0.34 or a third of every naira of the bank's existing net asset.
In the last ten years, UBA's P/BV has not exceeded N1 except in 2013. In the previous five years, P/BV ranged between 0.67 in 2017 and 0.34 in 2021. The historical P/BV reinforces what appears to be a broad market pricing anomaly.
Even banks that are a hundred years old suffer the same price to net asset bane. A case in point is FBNH.
FBNH: Beyond Age
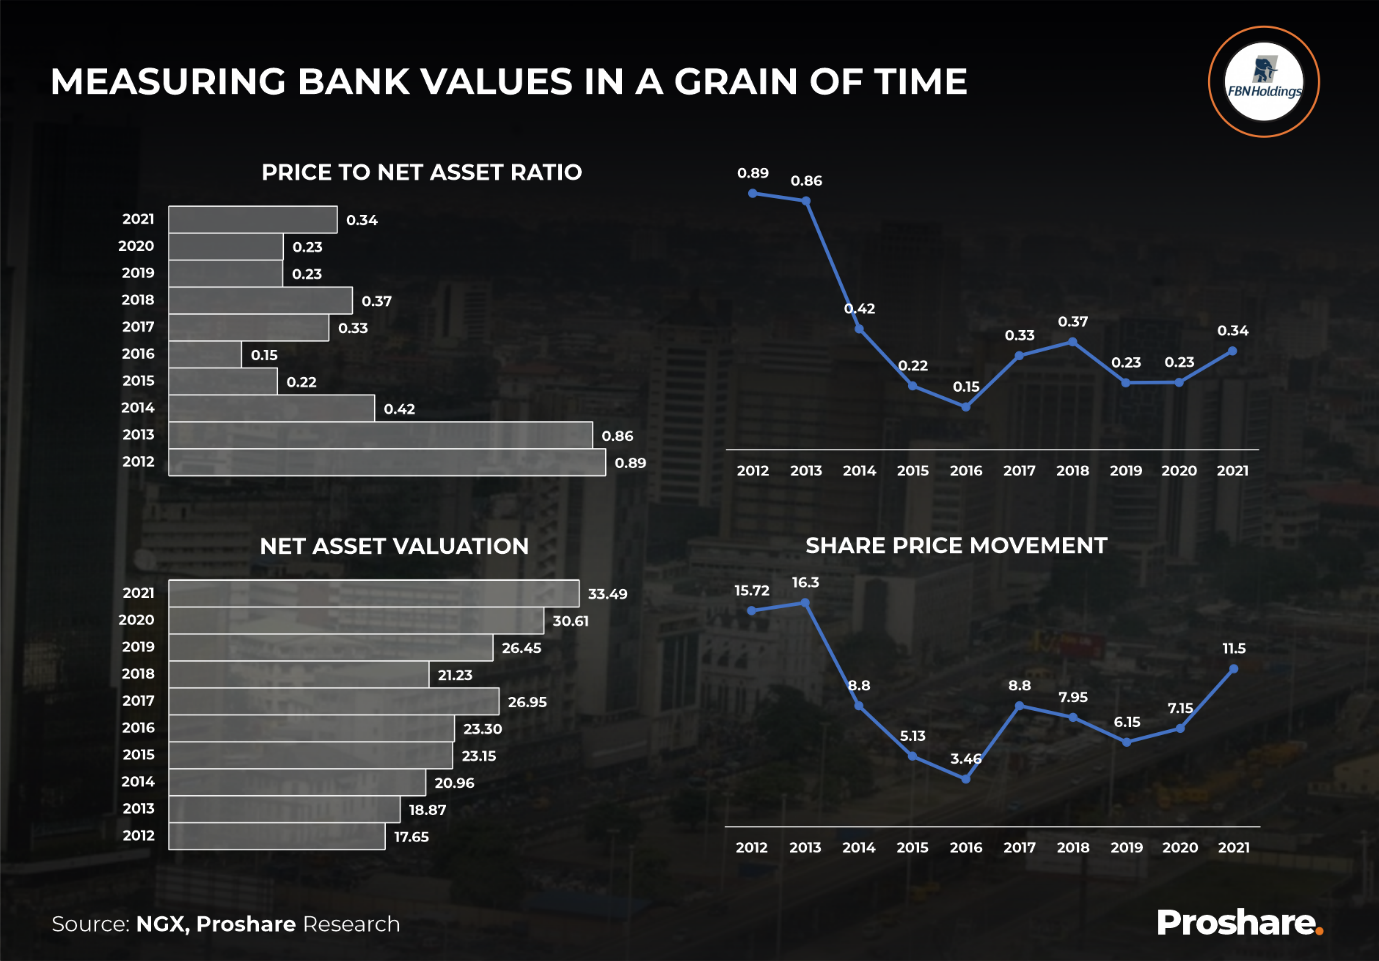
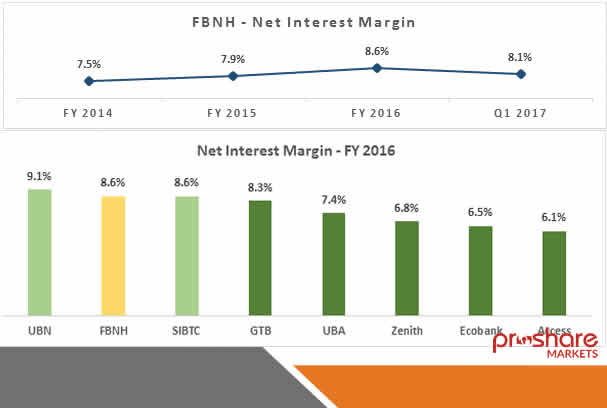
FBNH is the oldest financial lender in Nigeria but, in recent years, has had a problem or two with the quality of its risk assets and corporate governance. The issues have hurt performance, but its share price to book value is in sync with other banks listed on the NGX.
Over the past decade, the financial holding company has had a P/BV below one. The highest P/BV ratio was seen in 2012, when it was 0.89. With the lender's share price dipping from N16.30 in 2013 to N3.46 in 2016, the Holdco's P/BV tumbled by -82.56%.
On December 31, 2021, the deposit money bank's (DMB's) price was a third of its net asset. The implication was that if the lender were bankrupt on this date, buyers would pay only one-third of the net value of the DMB. The reason for potentially selling FBNH at a deep discount is unclear. But, the current P/BV kicks the old lady's corporate worth downhill. Indeed between 2018 and 2019, investors could pick up the Holdco's net asset at 23 kobo on a Naira (see chart 3 below).
Chart 3 FBNH's P/BV Discounts A Rich History
StanbicIBTC: In Praise of Non-Normality
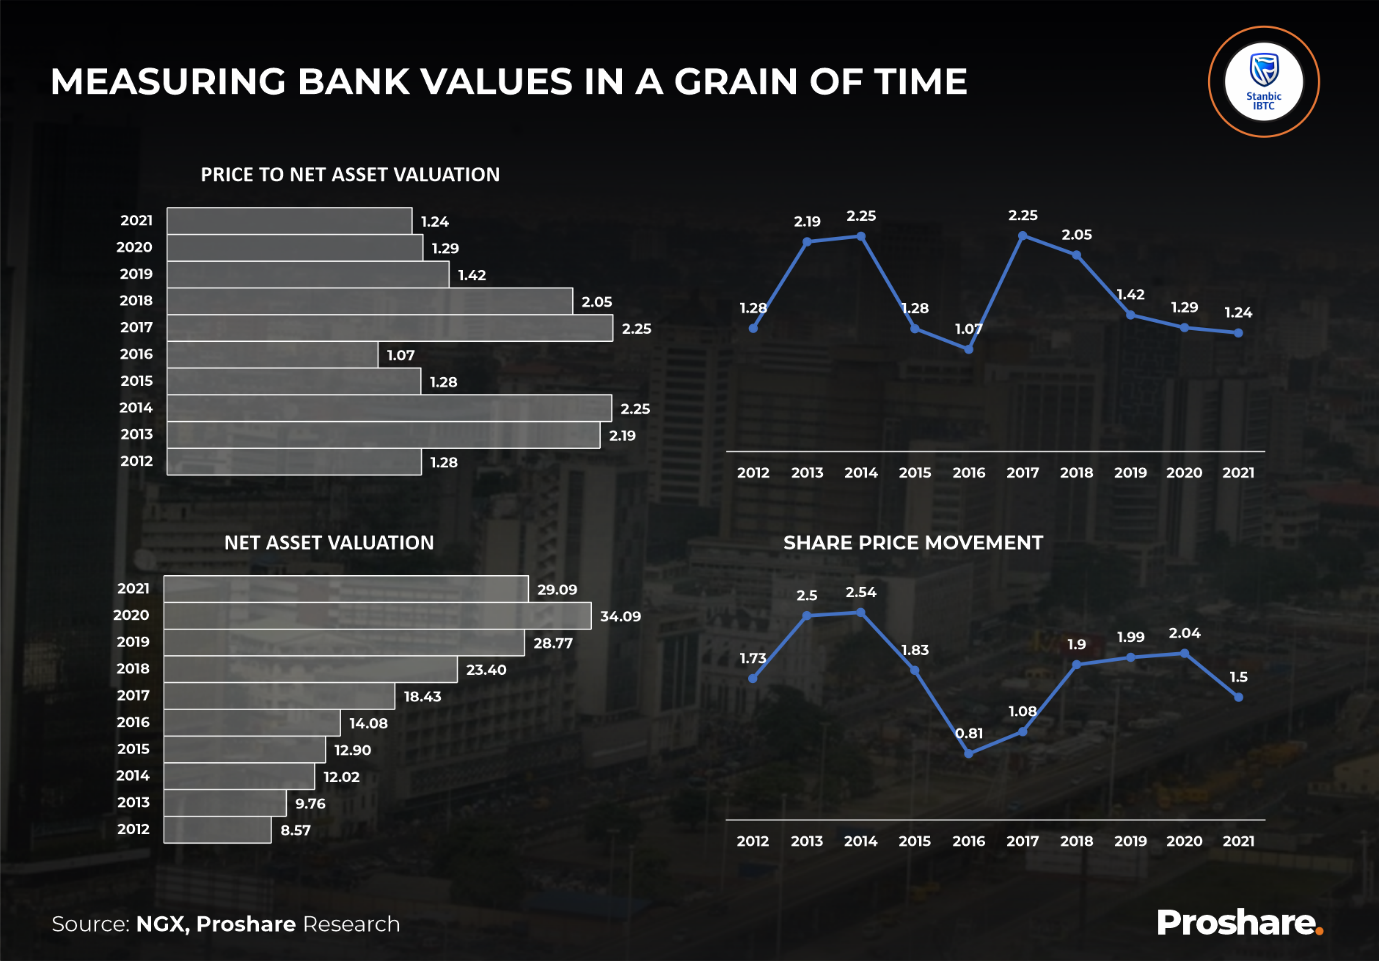
Being 'normal' can, at times, be a burden. Non-normality has its sweet side, or so it seems. Unlike other banks in Nigeria, StanbicIBTC, for example, has sustained a decade-long share price that considers its net asset value.
Between 2012 and 2021, the lender's P/BV has stayed above one. The ability of the bank to keep P/BV adequately high suggests that capital market operators (CMOs) have exceptional regard for the quality of the banks assets and its management even though P/BV has declined over the last ten years, particulalry over the last five years.
The bank's compound average annual net asset growth in the last ten years was +14.54%. In contrast, the compound annual average fall in the bank's share price was by -1.70% (see chart 4 below).
Chart 4
In a new Proshare report to be released shortly on recalibrating the definition of tier 1 banks in Nigeria (Nigerian Banks: A Case for Redefining Tier 1), the analysts made a case for both StanbicIBTC and Fidelity Bank to feature in the evidence-based list of institutions qualified as tier 1 based on a model Proshare called the Bank Strength Index (PBSI) which was an improvement on the criteria for tier 1 bank measurement developed by local investment bank giant, Afrinvest, in 2013.
Fidelity Bank's Price-to-Value Seesaw
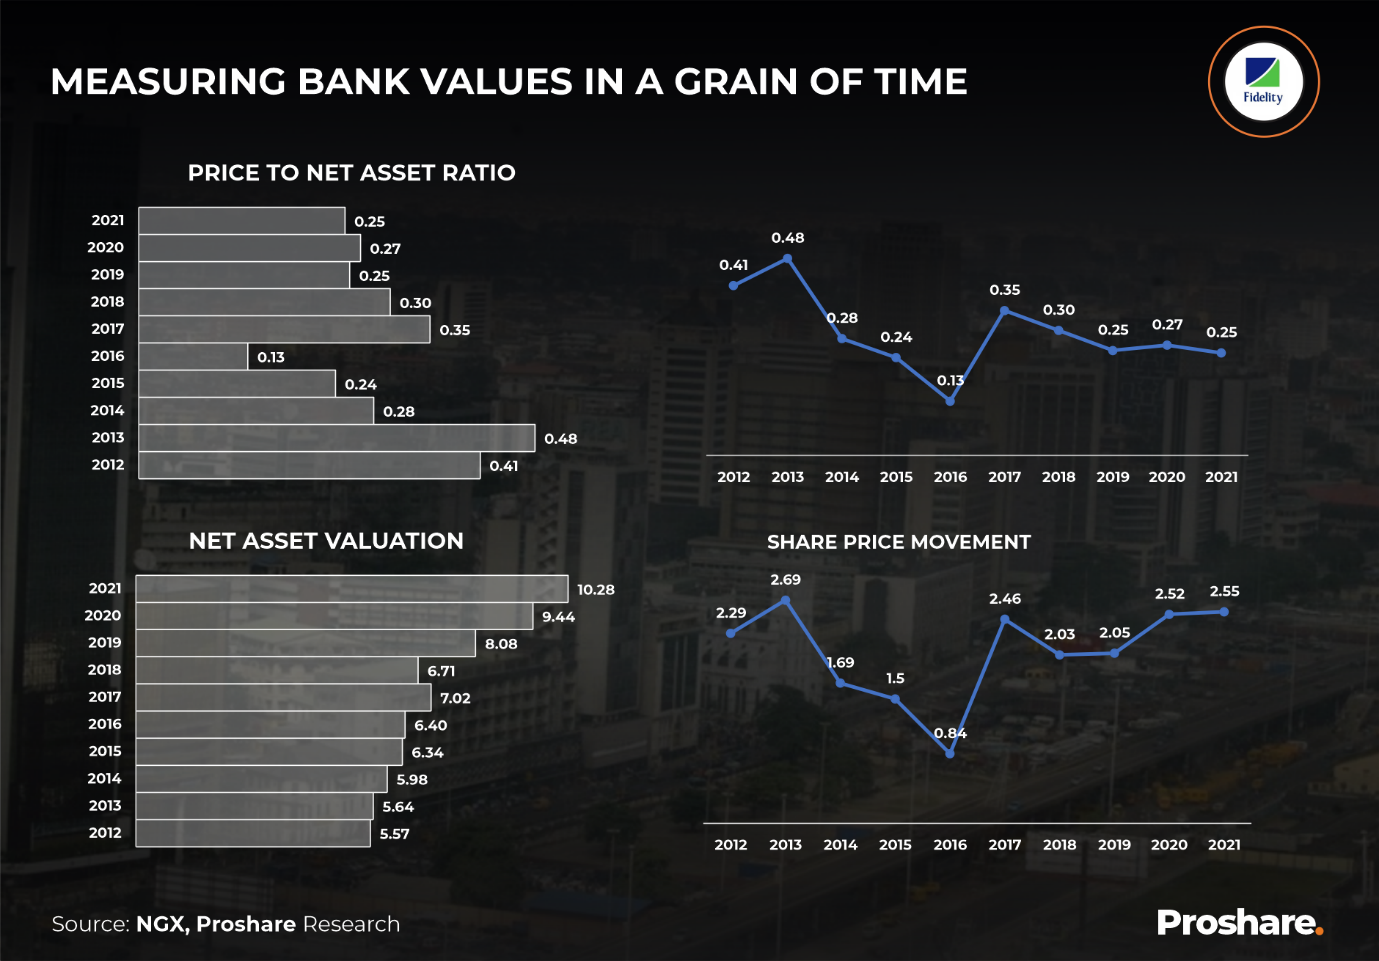
On a price-to-book value (P/BV) basis, Fidelity Bank contrasts sharply with its StanbicIBTC counterpart. While StanbiIBTC has held up a P/BV above one over the last ten years, Fidelity Bank has never met the cut. Fidelity Bank's highest P/BV in ten years was in 2013 when it rose from 0.41 in 2012 to 0.48 in 2013 (see chart 5).
Chart 5 Fidelity Bank's Sliding Price-to-Book
The Foreign Brigade
Of Share Prices and HSBC
Like Nigerian banks, HSBC's P/BV has taken a knock or two over the last decade, sliding from 100.78 in 2012 to 57.81 in 2021. However, unlike their Nigerian counterparts, HSBC's P/BV has remained above one. In the last decade, it had never dropped below 50 except in 2020 when it slid to 49.66 after global economic meltdowns caused by the COVID-19 pandemic shrunk worldwide trade and commerce.
In the last decade, HSBC's P/BV has tumbled by -5.99% on a compound average annual basis, while its share price has dipped annually by -6.01% over the last decade(see chart 6 below).
Chart 6 HSBC’s Declining P/BV, Watching an Asian Sunset
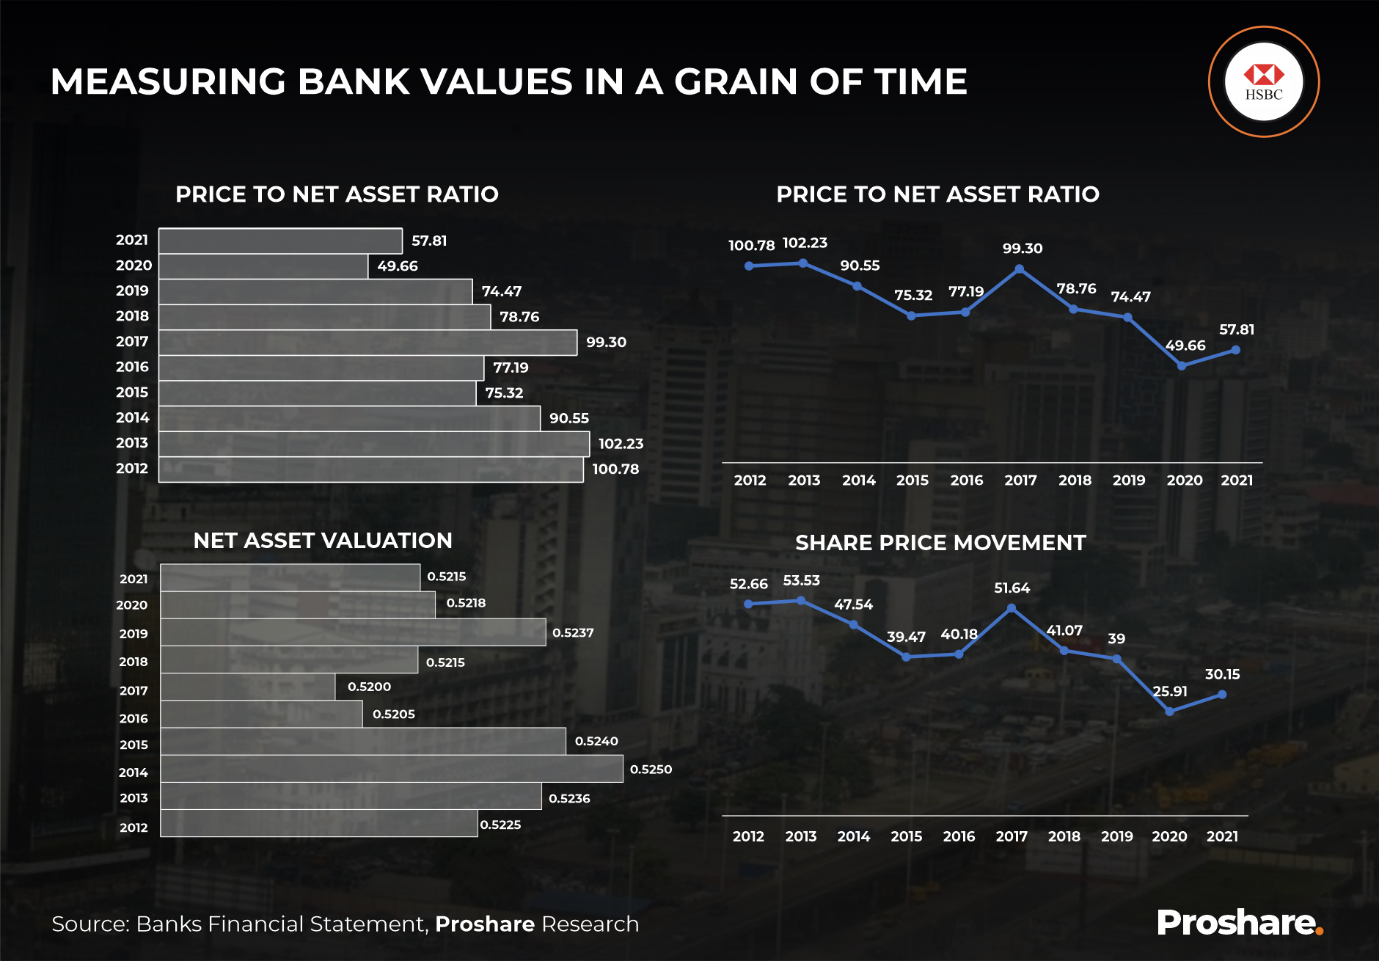
The statement of financial position or balance sheet values of HSBC seems to have been pounded down by slower global economic growth over the last half-decade. As the bank's share price continued to fall, its Price-to-Book Value steadily slumped. One explanation would be that loans and advances rose faster than share prices as earnings moved in quick time. The problem here was that the bank's net asset growth for most of the decade was flat at 0.52, so most of the Price-to-Book Value changes depended on price movements rather than net asset adjustments.
Over the same period, America's Wells Fargo has had a slightly different tale to tell.
Wells Fargo: When Prices Mirror P/BV
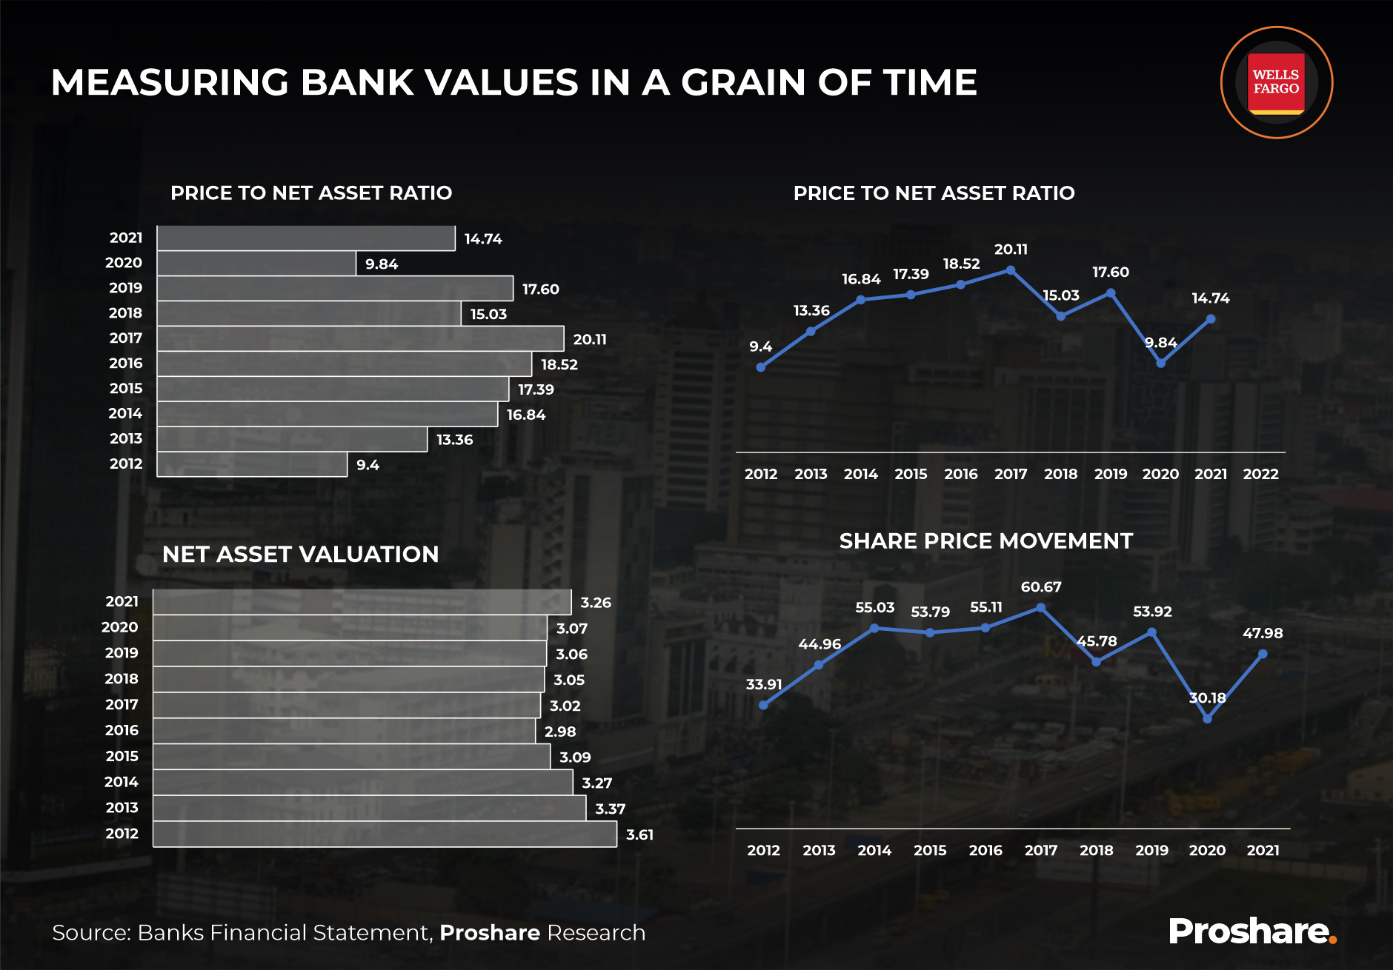
Wells Fargo’s P/BV steadily rose throughout the early to mid-2000s. Not even a recession between 2015 and 2017 stopped the market from pushing up the bank’s price relative to net assets or its book value.
Fargo’s price has declined modestly over the last four years with dips being followed by spikes between 2018 and 2021. The bank’s share price fell from N60.67 at the end of 2017 to N45.78 in 2018 and reversed to N53.92 in 2019. By 2020 the bank’s share price dipped again to N30.18 before a trampoline jump to N47.98 in 2021. The lenders P/BV followed a similar pattern, suggesting that price rather than net asset size was the principle driver of asset valuation at the bank in the last ten years.
Wells Fargo’s net assets have been fairly flat over the last decade averaging US$3.18trn. In the general scheme of things, the bank traded at a ten-year average of 15.28 times its book value, which is a far cry from the low levels of Nigerian banks over the same period.
Between 2012 and 2017, Wells Fargo saw a steady climb in its P/BV before a post-global recession decline in 2018. Again this was another detour from the typical pattern amongst Nigerian banks (see chart 7 below).
Chart 7 Wells Fargo's P/BV Jumping Jack
The Messy Misalignment
Nigerian market analysts believe what they had suspected for some time, that Nigeria's equity market pricing was inefficient. The low P/BV for most banks listed on the local NGX suggests that investors heavily discount bank assets and concentrate strictly on discounted dividends or earnings cash flow. The jury is still out on this, but what is clear is that bank assets need to be priced into share prices to establish baseline valuations.
Monday morning quarterbacking or second-guessing market values without assessing asset values will not cut it. Bank loan assets create the stream of cash flows that lead to corporate bottom lines, so a valuation of these and corporate fixed assets is essential to the corporate valuation process. Closing one's eyes to avoid the demons in the dark is not an intelligent risk protection strategy. Likewise, looking at earnings without considering assets is flawed.
Four Reasons and a Correction
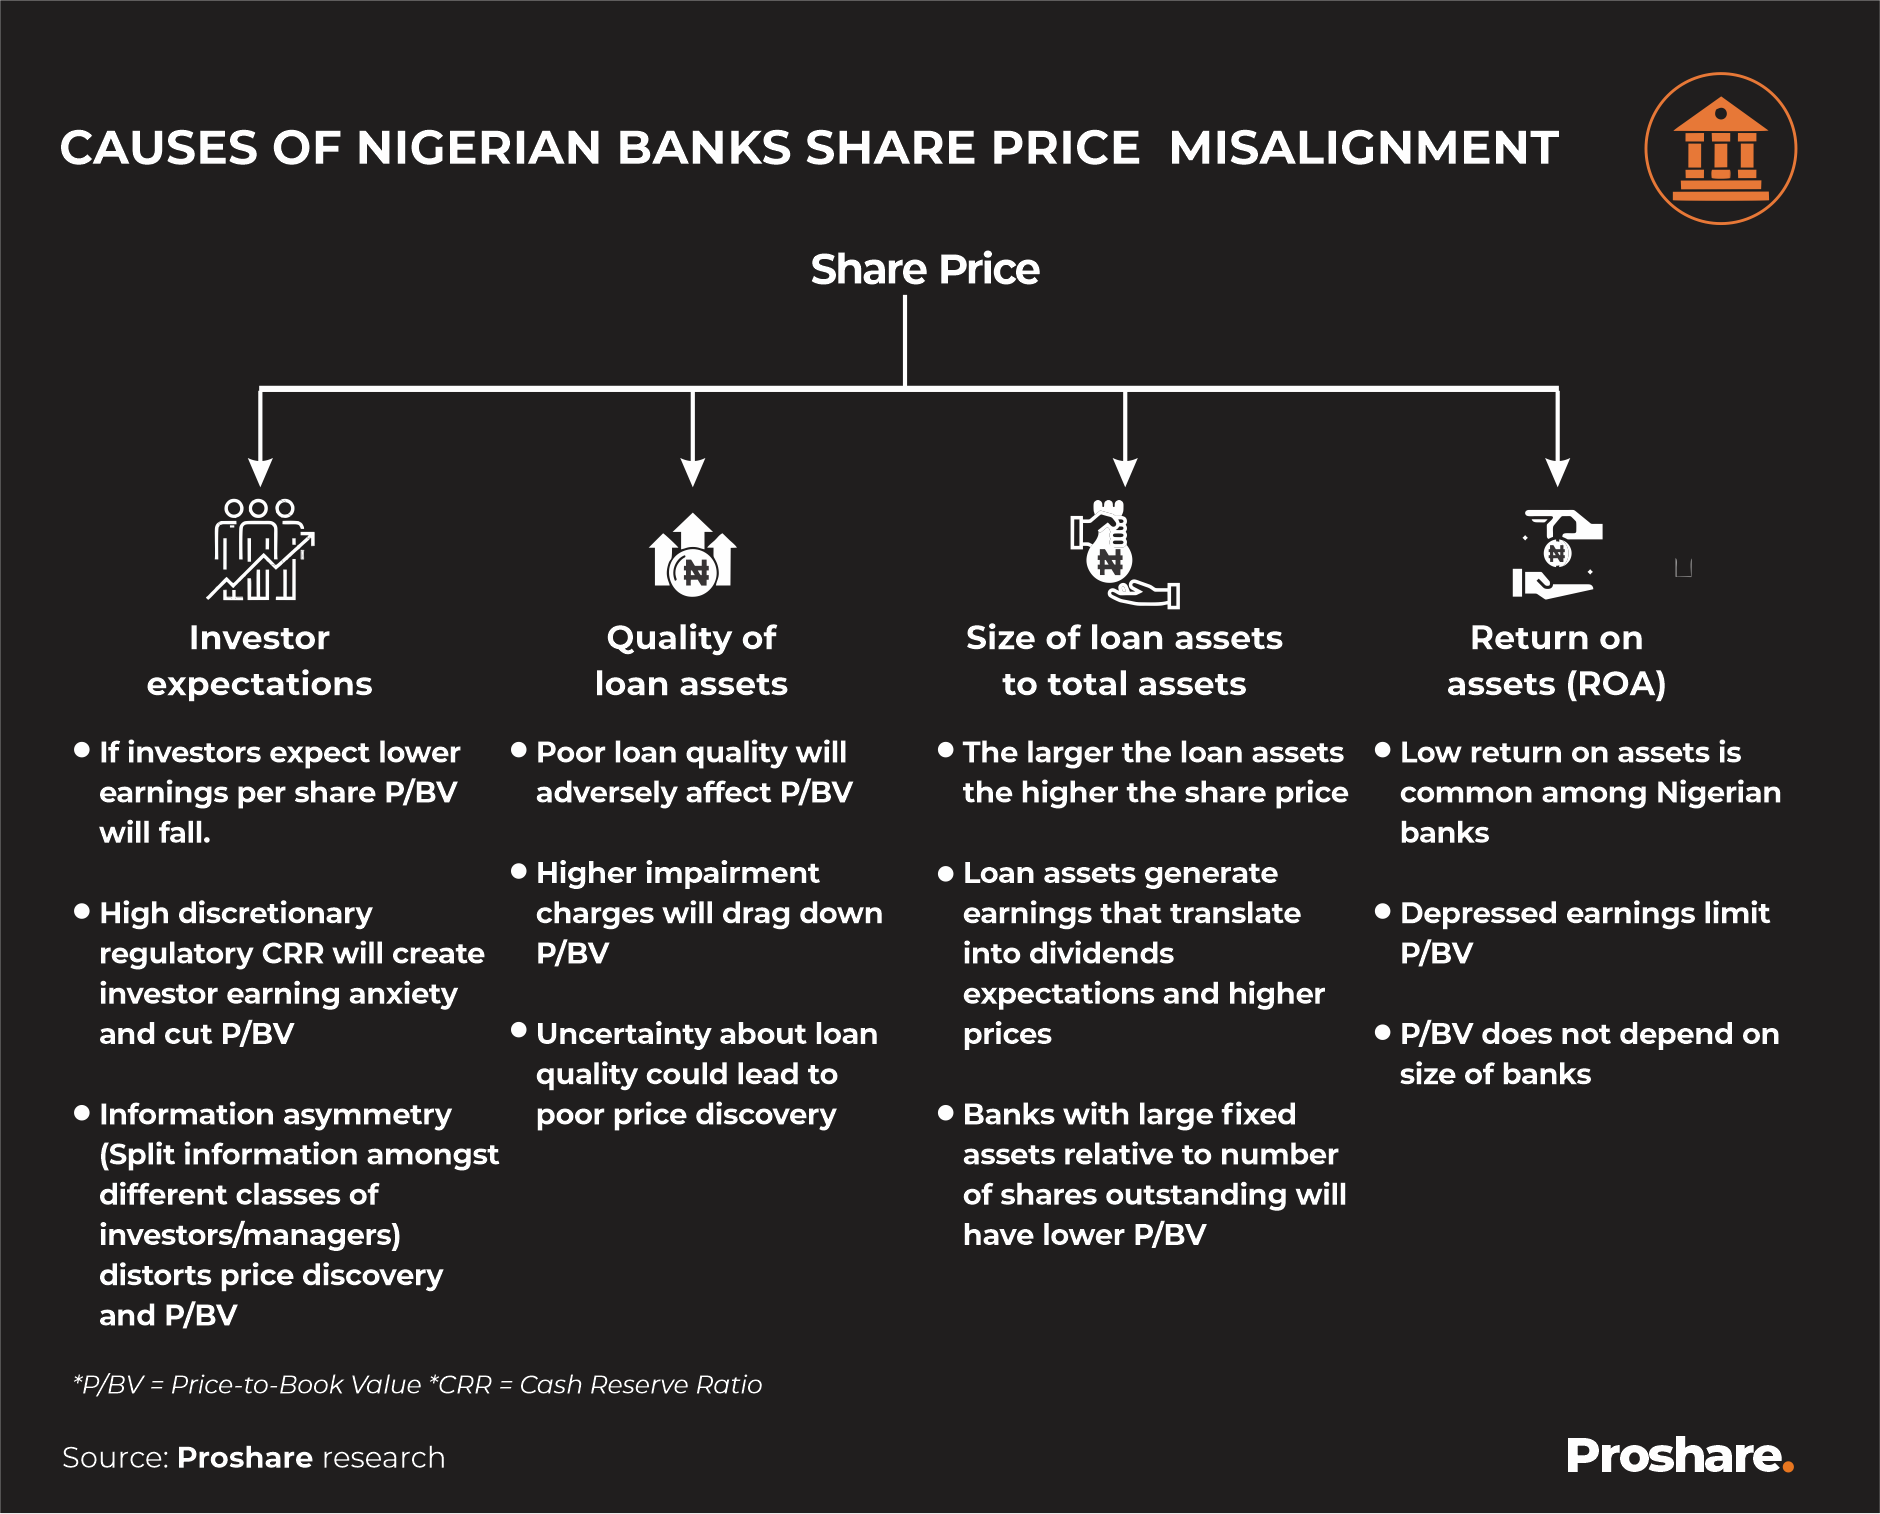
The first reason share prices relative to assets are low is that investors became (and are still) fixated with earnings. Earnings expectations are high-priority considerations for number crunchers, with assets seen as less important. Nevertheless, in banking and other sectors, profits and assets are essential.
For example, the CBN used discretionary cash reserve requirement (CRR) as a tool for monetary policy tightening and loosening and an instrument for keeping the troops in line. Why should this matter? A bank with a high CRR would have fewer assets to create earnings, translating into a lower bottom line and a depressed share price. A lower share price would lead to a lower P/BV assuming net assets do not fall.
The second reason for some share price anomalies is that loan asset quality is hard to discern. The most straightforward approach is to look at impairment provisions; the higher the provisions, the poorer the likely quality of loan assets. Higher impairment charges would depress net earnings and drag down share prices regardless of whether net assets grow.
With loan assets relatively low for some banks (below the CBN's statutory loan-to-deposit (LDR) ratio of 65%), their loan to total assets ratio may equally be muted, meaning CMOs would likely discount their share prices. The higher the proportion of loans and advances to total assets, the higher bank share prices and the third reason for lags between share price movements and net assets.
Few Nigerian banks have a return on assets (RoA) above 2%, and this is perhaps a fourth reason for depressed share prices relative to assets. Low earnings relative to bank assets at times reflect the constraints on banks to grow their loan books as CBN measures such as discretionary CRR serve as a rugged leash. Market intelligence available to Proshare suggests that even banks under CBN forbearance worry about CRR. One such bank has a zero interest-earning CRR of roughly N220bn. The bank has wafer-thin shareholders funds, cannot create new risk assets without CBN approval and is incapable of spending on capital development (CAPEX). Indeed, according to gathered information, the bank cannot buy new vehicles or office equipment. The problem is not money but CBN permission which could take a while.
However, given these circumstances, the bank's managers have pivoted towards corporate banking and SME finance. So, what is the bank's P/BV? It is uncertain as the bank is not one of the thirteen on the NGX. Analysts believe that its P/BV may lie deep at the bottom of a value pond(see illustration below).
Illustration 1 Nigerian Banks and Misaligned Share Prices
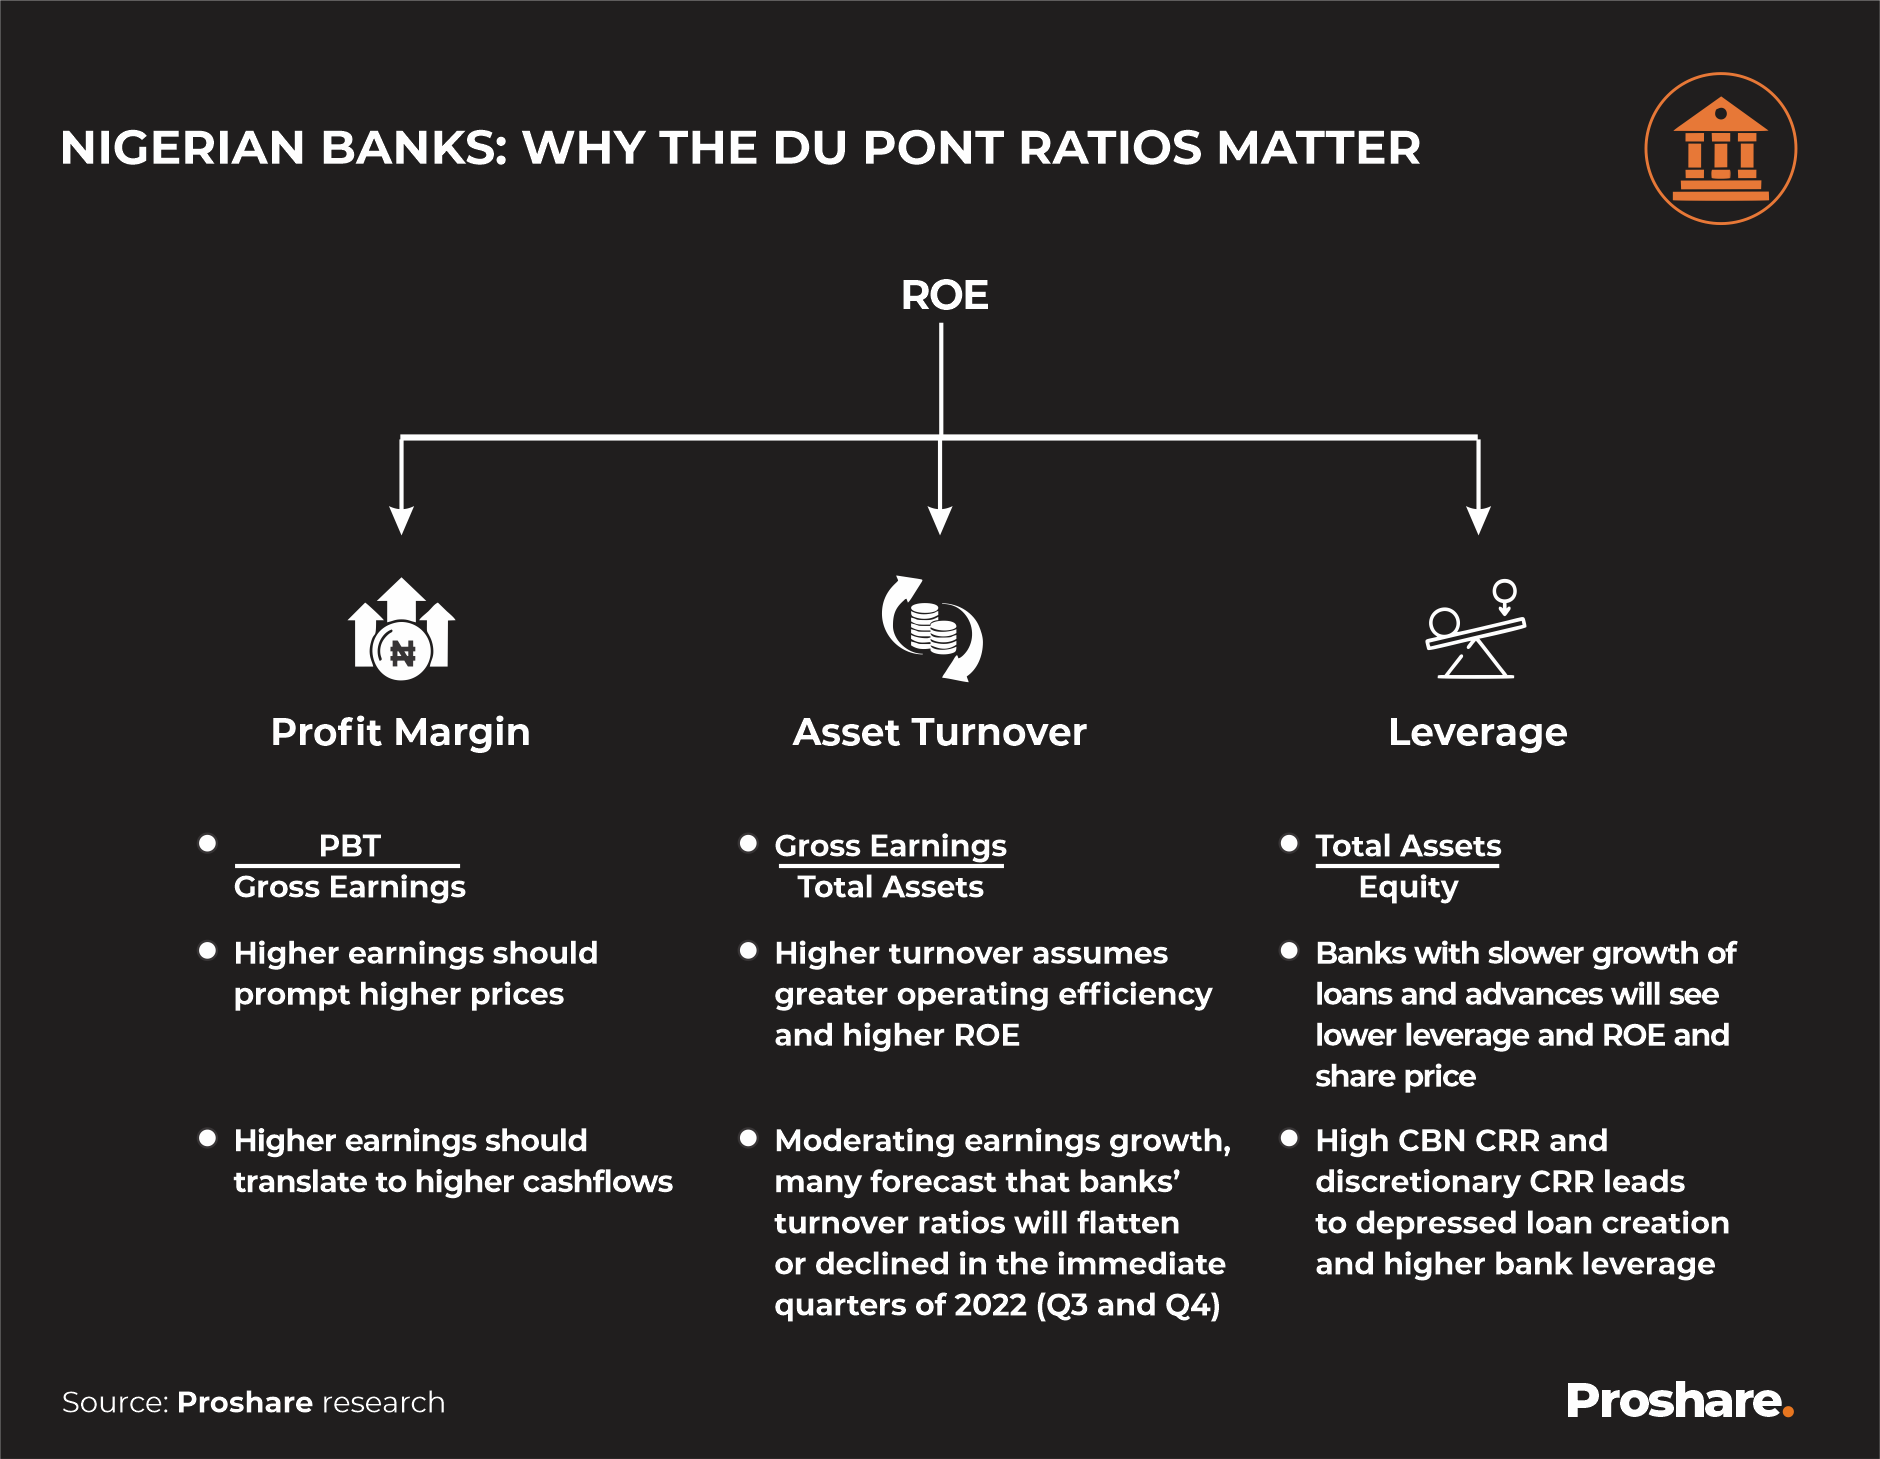
Meanwhile, analysts in growing numbers are asking, does return on equity (RoE) count for anything? Certainly. Number crunchers note that the traditional Du Pont ratio gives insight into the key drivers of bank earning performance and their likely stock price direction. Banks with high RoEs are likely to have higher prices and higher P/BVs (see illustration 2).
Illustration 2 Nigerian Banks and the Du Pont Ratio
Endnote
Corporate finance experts may need to review Nigeria's corporate asset values to realign price to underlying company networth. Even where market sentiments go into hyperdrive, they need self-correction to re-establish a nexus between value and price.
Warren Buffett, the iconic Chairman of Berkshire Hathaway, was once famously quoted to have said that "Price is what you pay; value is what you get." Buffet might have been right, but in Nigeria's feisty equity market, "price is what you pay, value is what you ponder," or so it seems.


 Sponsored Ad
 Advertise with Us


 Back to top