 Lagos, NG • GMT +1


 8687 views
Thursday, August 17, 2017 11.05AM / Proshare Research
Assessing banks’ financial performance is one due diligence that must be done by both existing and potential investors before key investment decisions are taken in relation to the banking industry.
Ratio analysis is one sure way of achieving this as it will clearly throw the needed light on the performance as well as the financial stability of the bank (s) in question.
In determining the 2016 year-end financial performance and positions of Tier 1 and 2 banks in Nigeria, we shall examine the following ratios to understand where each bank(s) stand presently.
Yield on Interest Earning Assets
Among the tier 1 banks, UBA has the best yield on interest earning asset as at FY 2016 with 11.5% yield recorded. FBNH is next among tier 1 banks with 11.5% yield on interest earning asset recorded.
Overall, UBN, a tier 2 bank, is the leader with 13.6% yield followed by STANBIC (13.0%), UBA (11.8%), GUARANTY (11.1%), ZENITHBANK (10.9%), ACCESS (10.9%) and ETI (9.8%).
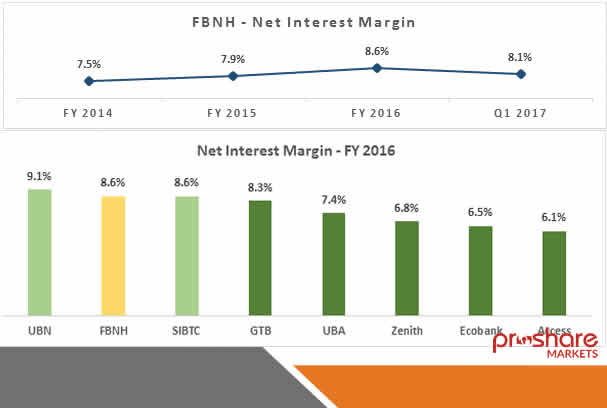
Net Interest Margin
Net interest margin reported by Tier 1 and Tier 2 banks are largely in the same range as UBN recorded 9.1%, FBNH & STANBIC 8.6% and GUARANTY 8.3%. UBA followed closely 7.4% NIM recorded, Zenith (6.8%), Ecobank (6.5%) and ACCESS with a relatively lower NIM of 6.1%.
FBNH’s NIM has continued to inch up YoY, closing FY 2016 at 8.6%, up from 8.1% and 7.6% in 2015 and 2014 respectively. The NIM expansion in FY 2016 was driven by the faster increase in yield on assets and reduction in cost of funds. This was largely due to the 28.5% drop in interest expense on deposits, reflecting the impact of lower interest rates and a cutback of expensive deposits in 2016.
Cost to Income Ratio
After GUARANTY, FBNH maintained a very good cost-to-income ratio compared to other Tier 1 and Tier 2 Banks as UBN, ETI, ACCESS, UBA, STANBIC and ZENITHBANK recorded cost to incmoe ratio of 66.2%, 62.7%, 58.8%, 56.3%, 54.8%, 48% respectively.

FBNH’s cost-to-income ratio improved significantly in the last two years, trending downwards, from 61.3% in FY 2015 to 47.0% in FY 2016. 
Cost to Deposit
DIAMONDBNK, GUARANTY and UBA had better cost to deposit ratio with 2.4%, 2.7% and 3.2% recorded respectively in FY 2016 while ACCESS (4.2%), STANBIC (4.0%) and ZENITHBANK (4.0%) as against 3.6% ratio recorded by FBNH which maintained a health cost to deposit ratio when compared to the last three bank mentioned. 
For more details on Banking Sector Performance, kindly download our FBN Holdings Plc Comprehensive Performance Assessment Report
Related News
1. Market Extends Two-Day Losing Streak; Dips by -2.65%
2. NSEASI Dips Further by -2.25% as Market CAP Closes Below N13trn Mark
3. Stock Market Opens The Week Negative as NSEASI Dips by -0.65%
4. The New Banking Rally Starts NOW
5. FBN Holdings Plc: What The Fundamentals Say
6. Zenith Bank Reports Q2 2017 Results - Loan Loss Impairments and OPEX Spiked
7. Union Bank Plc H1 2017 Conference Call & Earnings Presentation - The Key Takeaways
8. Corporate Earnings for the Week Ending 110817 – ZENITHBANK Declares N75.32bn PAT in Q2 2017 Results
9. UNITYBNK Declares N2.09 billion PAT in Q2'17 Results,(SP:N0.64k)
10. FCMB Declares N3.02bn Profit in Q2'17 Results, (SP:N1.31k)
11. DIAMONDBNK Declares N9.32 billion PAT in Q2'17 Result,(SP:N1.33k)
12. UBN declares N9.2billion PAT in Q2 2017 Results,(SP:N5.43k)
13. FBNH Declares N29.5bn PAT in Q2 2017 Results,(SP:N5.97k)


 Sponsored Ad
 Advertise with Us


 Back to top