 Lagos, NG • GMT +1


 235 views
Thursday, April 07, 2022 / 9:16 PM / Jariyat Bakare & Abdulqudus Isiaka, Proshare Research / Header Image Credit: Ecographics/Fidelity Bank
Fidelity Bank Plc's financial year ended December 31, 2021, result was impressive. Gross earnings rose by 21.61% from N206.20bn in FY 2020 to N250.77bn in 2021. The rise in earnings was a lash at macroeconomic head winds that had emerged out of manufacturing supply constraints, rising domestic interest rates, and falling consumer demand.
A push towards improved digital penetration (23% of the bank's non-interest income came from electronic banking), delinquent loan recovery (non-performing loans fell by 65%), and a muscling down of cost to income ratio (CIR), created the platform for improved profit before tax. Nevertheless, a fourth of the bank's deposits remained in high-cost deposits which showed up in a major rise in interest expenses and a flattening of net interest income growth.
Analysts note that the huge delinquent loan recovery in 2021 was not likely to be replicated in 2022, and therefore, a key driver of improved performance in the year must be something other than this Profit and Loss Statement item.
Key Highlights
- Gross earnings increased year-on-year (Y-o-Y) by +21.61% from N206.20bn in FY'2020 to N250.77bn in FY2021 (decreased by -5.67% in USD terms from $475mn to $432mn in 2021)
- PBT grew Y-0-Y by +35.69% to N38.07bn in FY 2021.
- Earnings per share rose Y-o-Y by +33.69%, from N0.92 in 2020 to N1.23 in 2021.
- Return on average equity increased to +12.5% in 2021 from 10.5% in 2020.
- Total assets increased Y-o-Y by +19.2% from N2.76trn in 2020 to N3.29trn in 2021 (decreased by -10.8% in USD terms from $6.35bn to US5.67$bn in 2021)
- Fidelity Bank's Non-Performing loans declined to 2.90% in FY2021 from 3.80% in FY'2020
- Cost-to-income ratio decreased -20bp to 64.90% in FY'2021 from 65.10% in FY 2020.
- Capital Adequacy Ratio (CAR) increased to 20.10% in FY 2021 from 18.20% in FY 2020.
- Total equity grew Y-o-Y by +8.8% from N273.5bn in 2020 to N297.77bn in 2021.
- Digital Income accounted for 23% of non-interest income.
- Committed to becoming a tier 1 bank by 2025
Share Price Movement
After dropping in the first half of 2021 from N2.11 in January 2021 to N1.89 in May and N1.7 in July, Fidelity Bank's share price shuffled along an upward corridor for most of the second half of 2021, hitting N2.47 by September 2021 gaining 17% YTD. By year-end, the bank's share price had risen to N2.55 bringing the YTD gains to 20.8%. The banks shares price movement mirrors the market with a 0.73 correlation between the bank's share price and the NGX All Share Index (See chart 1 below).
Chart 1: Fidelity Bank Share Price and NGX ASI
Profitability
Gross Earnings
Gross earnings grew by +21.61% Y-o-Y from N206.20bn in FY'2020 to N250.77bn in FY'2021. Before 2021, the four-year average gross earnings were N198.38bn. The increase in gross earnings therefore reflects the improvement in the macro-economic environment in 2021. However, the bank's gross earnings in dollars decreased by -5.67% in from $475mn to $432mn in 2021 (see chart 2 below).
Chart 2: Fidelity Bank Gross Earnings (N'bn)
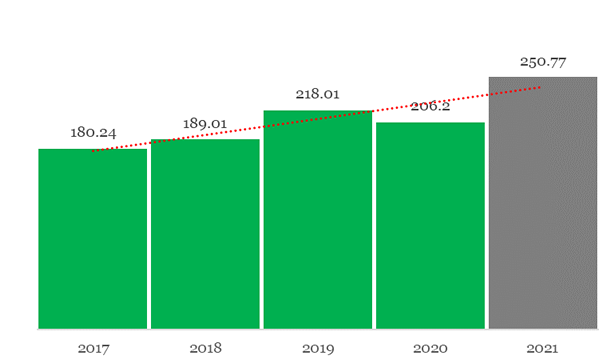
Source: Proshare Research, Fidelity Bank Financial Statement
Profit before tax
Fidelity Bank's profit before tax (PBT) rose by +35.69% Y-o-Y in FY'2021. Its PBT grew from N28.05bn in FY'2020 to N38.07bn in FY 2021. The improvement in PBT was largely driven by a combination of a +15.17% increase in interest income and a +10.82% growth in interest and similar income (see chart 3 below).
Chart 3: Fidelity Bank PBT (N'bn)
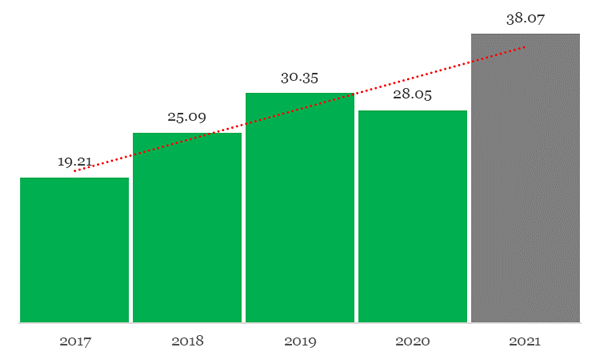
Source: Proshare Research, Fidelity Bank Financial Statement
Cost-to-Income Ratio (CIR)
Fidelity Bank's cost to income ratio (CIR) of the deposit money bank (DMB) fell slightly in FY'2021. Its cost to income ratio slipped from 65.10% in FY'2020 to 64.90 in FY 2021, indicating that for every N1 of revenue generated N0.65K was spent. Analysts noticed that the CIR of the bank had steadily declined from 2019 when the bank recorded 73.40% (see chart 4 below).
Chart 4: Cost-to-income Ratio (%)
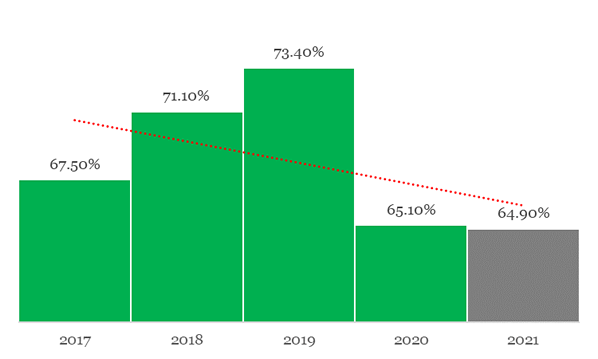
Source: Proshare Research, Fidelity Bank Financial Statement
Deposits from Customers
The FY'2021 Financials showed that Fidelity sustained its upward growth with customers deposits rising by+19.17%. Deposits received from customers grew from N1.699trn in FY 2020 to N2.02trn in FY 2021. Demand deposits accounted for the highest proportion of total deposits at 31.45%, growing by +6.74% Y-o-Y to N636.77bn in FY'2021


 Sponsored Ad
 Advertise with Us


 Back to top